Alpha Bands
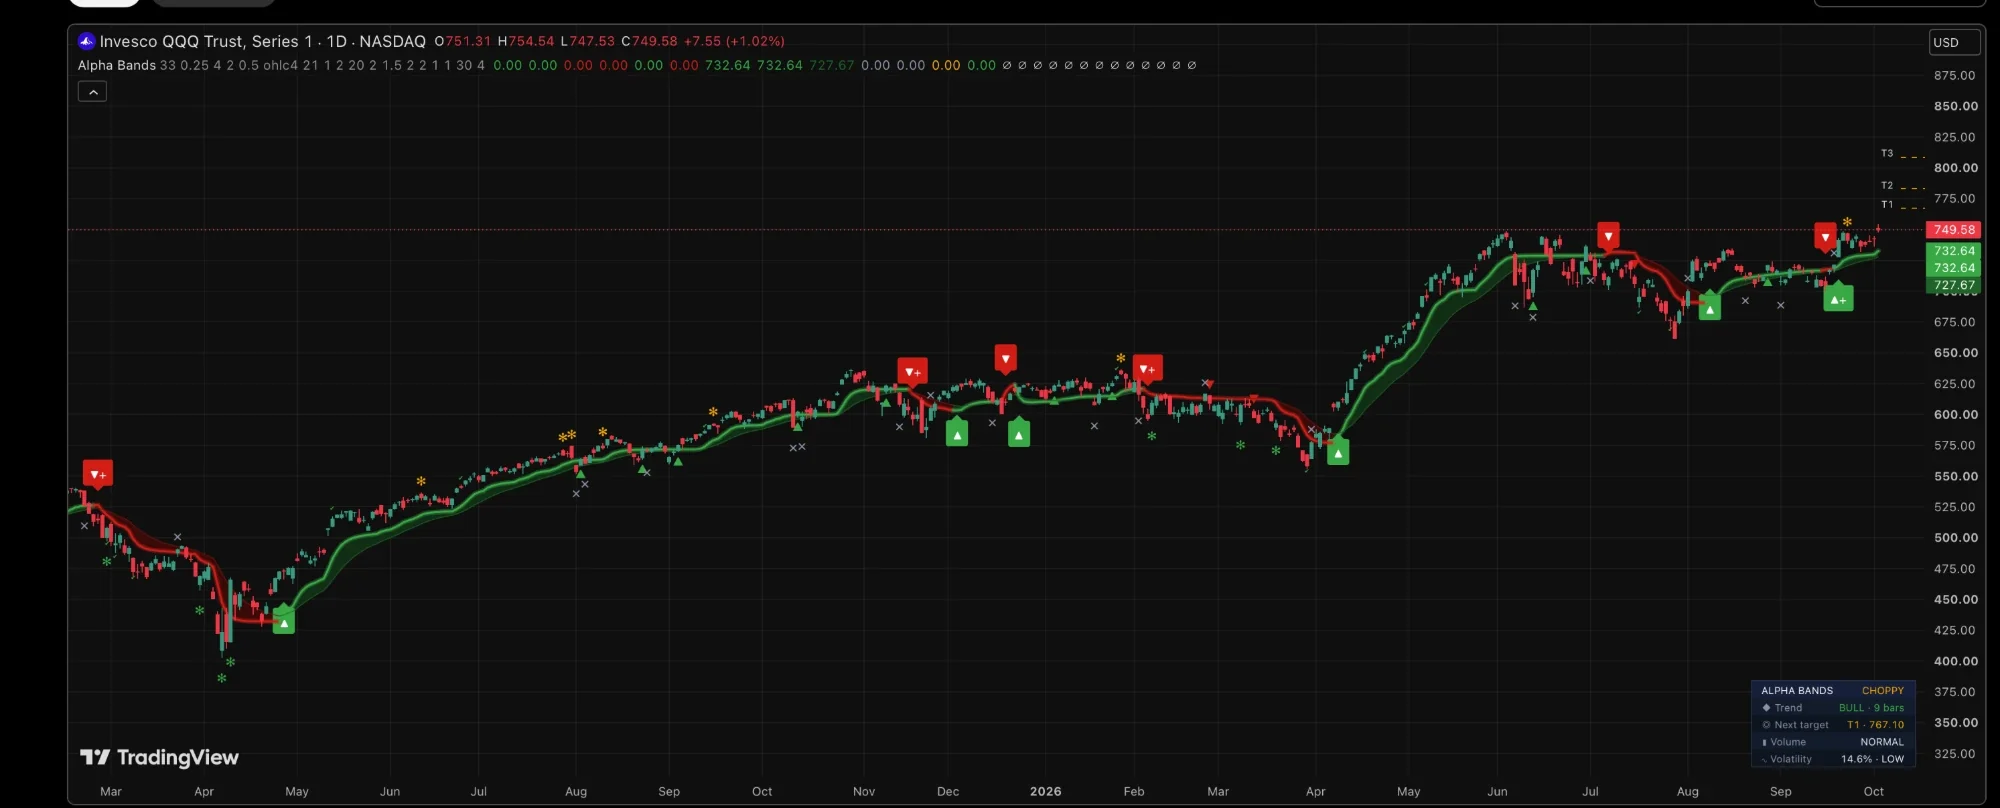
Alpha Bands is the trend layer of the suite. It tracks which side of the market is in control and holds that read until price proves otherwise, then carries the trade from the entry to the exit: the flip, the continuations, three targets and a trailing stop, all on one chart.
Key features
How the trend flips
The script builds a trend baseline from recent price action and draws a flip gate around it. The gate is a few tenths of a standard deviation wide, but never thinner than half an average range, so it stays wide in quiet, sideways markets, where most trend tools whipsaw. The trend only changes side when price closes through that gate on consecutive bars. A wick through it, or a single close, changes nothing.
The gate itself is hidden by default. What you see is the band, which hangs off the trailing stop: its bright edge is the price side, and it thickens as the stop lags a fast move. Turn on the flip zone in the settings to see where the regime actually flips.
Marks on the chart
Targets and the trailing stop
The moment a flip prints, the script measures the prior swing, from the last leg's extreme to the entry close, and projects it in the direction of the trade at 0.618, 1.0 and 1.618. Those are T1, T2 and T3. They are fixed at entry and float ahead of the last bar in amber until hit. The panel's Next target row shows the first one not yet reached.
The trailing stop is a chandelier: the highest high since the flip minus a multiple of the average range, mirrored for down-trends. It only tightens. A close through it prints the ✕ and ends the trade; the trend stays as it was until a flip says otherwise.
The market state panel
The corner table reads TRENDING or CHOPPY, then the trend and its age in bars, the next target, volume and volatility. Choppy means price has crossed the trend's centre too often in the recent window, the conditions where flips whipsaw. Volume is graded against the symbol's own recent average, volatility against its own year. The panel is informational: it never filters or hides a signal.
Settings
Defaults are tuned for daily trading on equities. Inputs are named by effect.
| Setting | Default | What it changes |
|---|---|---|
| Trend length | 33 | The lookback for the trend baseline. |
| Flip resistance | 0.25 | How much it takes for the trend to change side. Higher means fewer flips. |
| Smoothing | 4 | Smoothing applied to the baseline. 1 turns it off. |
| Confirmation bars | 2 | Consecutive closes needed to confirm a flip. Higher means fewer, later flips. |
| Noise filter | 0.5 | The gate's minimum width in quiet markets, in average ranges. 0 turns it off. |
| Trail distance | 2.0 | How much room the trailing stop gives the move, in average ranges. Higher means later exits. |
| Strong signal volume threshold | 1.0 | How heavy volume must be for a ▲+ or ▼+, in standard deviations. Higher means rarer. |
| Market noise lookback / threshold | 30 / 4 | The window and crossing count behind the CHOPPY verdict. A lower threshold flags chop earlier. |
| Overlays | All off | Fast and slow trend lines, a macro cloud and exhaustion zones. Context layers, off by default; their alerts run either way. |
How to use it
Read it in the order it prints. A ▲ or ▼ is the primary signal, and the + version the higher-conviction one. Triangles are the pullbacks that held, a way to join a trend you missed or add to one you are in. T1, T2 and T3 are the scale-out levels from the entry. The ✕ is the end of the trade: wait for the next flip or continuation. What you do with any of it is your decision, in your own account.
Alerts
Create one alert on Alpha Bands and pick "Any alert() function call". Every event arrives with the ticker, the timeframe and its name in the message: BUY and SELL flips, continuation BUY and SELL, T1 to T3 reached, EXIT long and short, exhaustion warnings, and the overlay flips. The full walkthrough is in the Alerts guide.