Alpha Structure
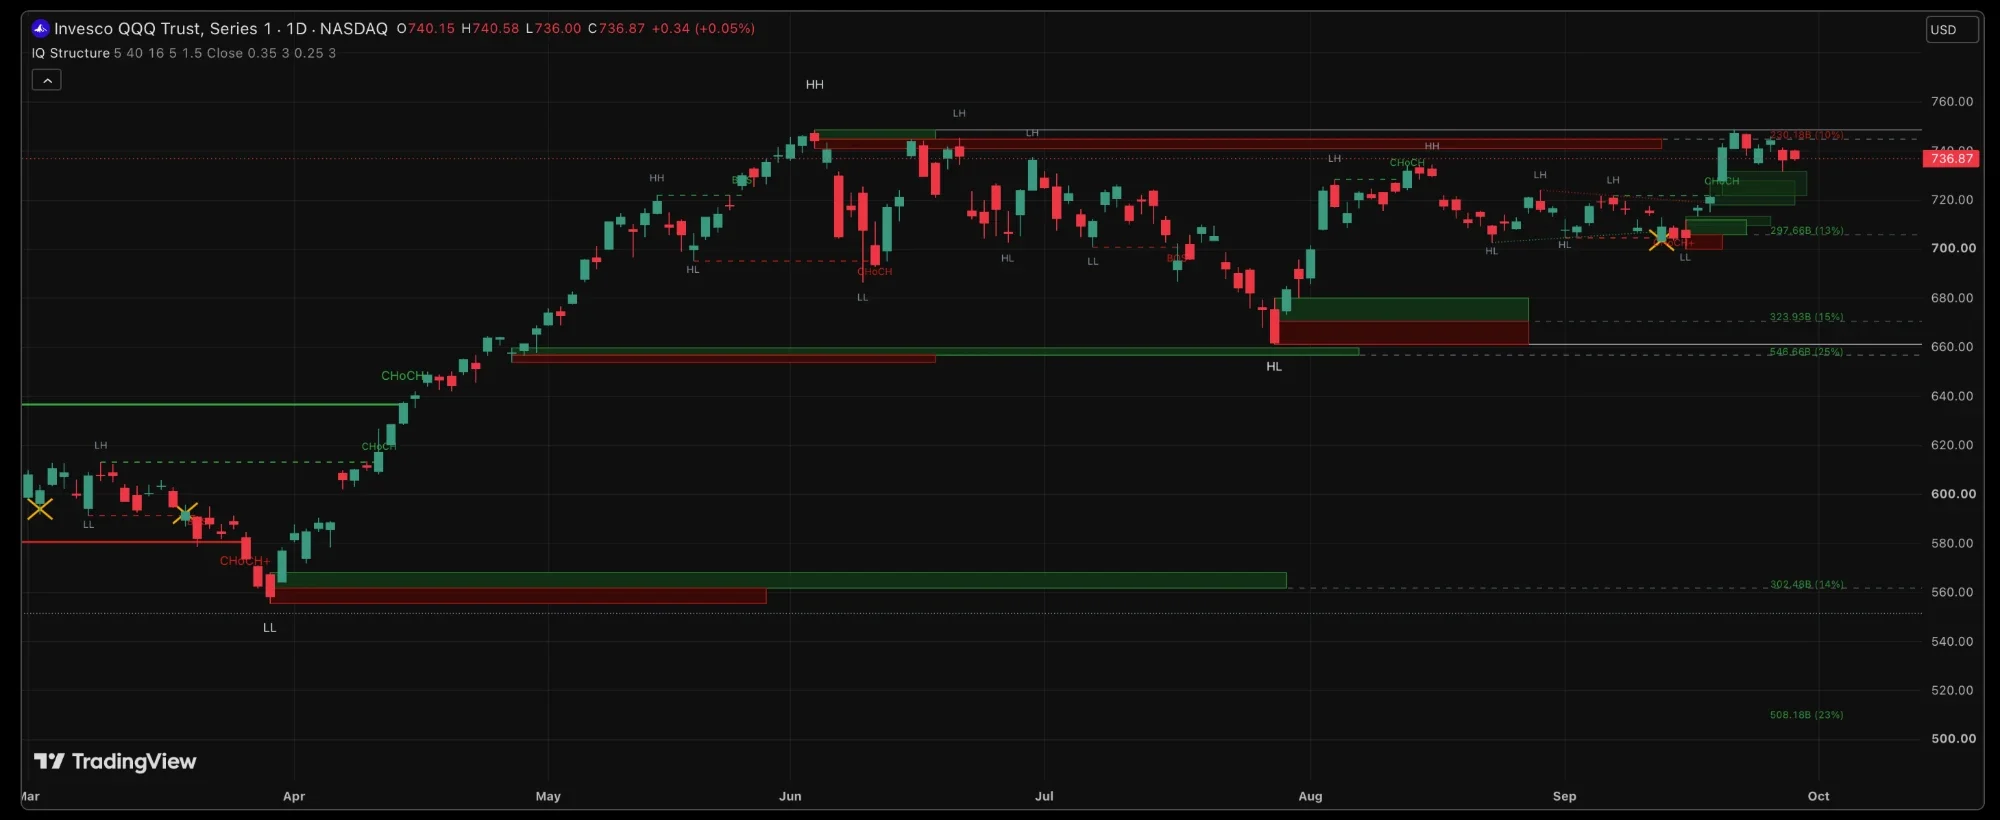
Alpha Structure is the map layer of the suite. It tags every confirmed swing, names every break as continuation or reversal, draws the trendlines, the order blocks, the fair value gaps and the liquidity levels, and clears each one the moment price invalidates it. The chart shows what is live, not a history of everything.
Key features
Two tiers of structure
A swing is confirmed once enough bars have printed on each side of it: five by default for the internal tier, forty for the major. Each confirmed swing is tagged HH, HL, LH or LL against the one before it. When a close breaks the last confirmed swing, the break is graded: BOS if it continues the prevailing structure, CHoCH if it flips it. A CHoCH that follows a failed push to a new extreme, a lower high before an upside break or a higher low before a downside one, is tagged CHoCH+, the stronger reversal.
The major tier adds level rays: the latest major high and low extend to the right as the chart's key levels until price breaks them, and that break is a major BOS or CHoCH.
Labels on the chart
Order blocks and gaps
When structure breaks, the script finds the extreme candle of the leg that broke it, the lowest candle for a demand zone, the highest for supply, and draws the zone there, with a minimum height of half an average range and oversized candles trimmed to their body. The leg's volume is split into buying and selling, and the two halves of the zone grow with its age in that ratio, so the zone's shape says who built it. A dashed mean line runs right to a tag with the leg's dollar volume and this zone's share of every visible zone. Zones built on heavy volume get a heavier outline. A zone dies on a close through it by default; the setting can make that a wick, or a close through the midpoint.
Fair value gaps are three-bar imbalances, drawn as compact boxes of fixed width once the gap is at least a third of an average range. They shrink as price fills them and disappear once filled.
Liquidity and trendlines
Two swings within a quarter of an average range of each other make an equal level, drawn dotted and tagged EQH or EQL. A wick through it with a close back inside is a sweep, marked with an amber x; a clean close through it removes the level silently. Rising support and falling resistance lines draw themselves from consecutive swings and extend right; on a confirmed close through, the line freezes dotted at the break.
Settings
Defaults are tuned for daily trading on equities. Inputs are named by effect.
| Setting | Default | What it changes |
|---|---|---|
| Structure sensitivity | 5 | The swing size for internal structure. Lower means more, smaller swings. |
| Major structure sensitivity | 40 | The swing size for major structure. Higher means fewer, bigger swings. |
| History shown | 16 | How many past structure breaks stay on the chart. |
| Zones kept per side | 5 | How many demand and supply zones stay live at once. |
| Strong zone volume factor | 1.5 | How heavy the anchor candle's volume must be for a heavy outline, against the 21-bar average. |
| Zone invalidation | Close | What kills a zone: a close through it, a wick through it, or a close through its midpoint. |
| Gap significance | 0.35 | The minimum gap, in average ranges, for a fair value gap to print. |
| Level tolerance | 0.25 | How close two swings must be, in average ranges, to count as equal. |
| Toggles | All on; trendline break marks off | Visuals only. Every engine and alert runs either way. |
How to use it
The major tier and its rays set the direction. A BOS with the trend is continuation; a CHoCH against it is the first sign of reversal, and a CHoCH+ the one to weigh. Zones are where the move started: watch the first return to one, and use the volume split to judge which side built it. Unfilled gaps tend to pull price back; a filled gap is done. EQH and EQL are where stops sit, and a sweep that closes back inside is often the turn.
Alerts
Create one alert on Alpha Structure and pick "Any alert() function call". Every event arrives named: bullish and bearish BOS and CHoCH at both tiers, a falling trendline broken up, a rising one broken down, liquidity swept above or below, and price entering a demand or supply zone. The full walkthrough is in the Alerts guide.