How Alpha Charts works
Every tool in Alpha Charts is built on one discipline: nothing counts until it closes, and nothing is worth acting on until it confirms. The indicators read a single chart with that discipline. The platform applies it across every timeframe and every ticker at once — so the thing you see is never a guess, it's a verdict that already survived its own bar.
The idea
Most indicators are fast and wrong: they repaint, they flip on wicks, and they make you the filter. Alpha Charts inverts that. The engines are deliberately sticky — a signal only prints when a close proves it, so the history you scroll back through is exactly what fired live. You trade fewer signals, and you stop relitigating them mid-bar.
The second principle is silent machinery, visible verdicts. The engines compute far more than they draw — hidden volatility bands, confluence scores, money-flow tiers. What reaches your chart is only the conclusion. When you want the reasoning, you ask the Analyst and it quotes the engine's own state back to you in plain language.
The suite
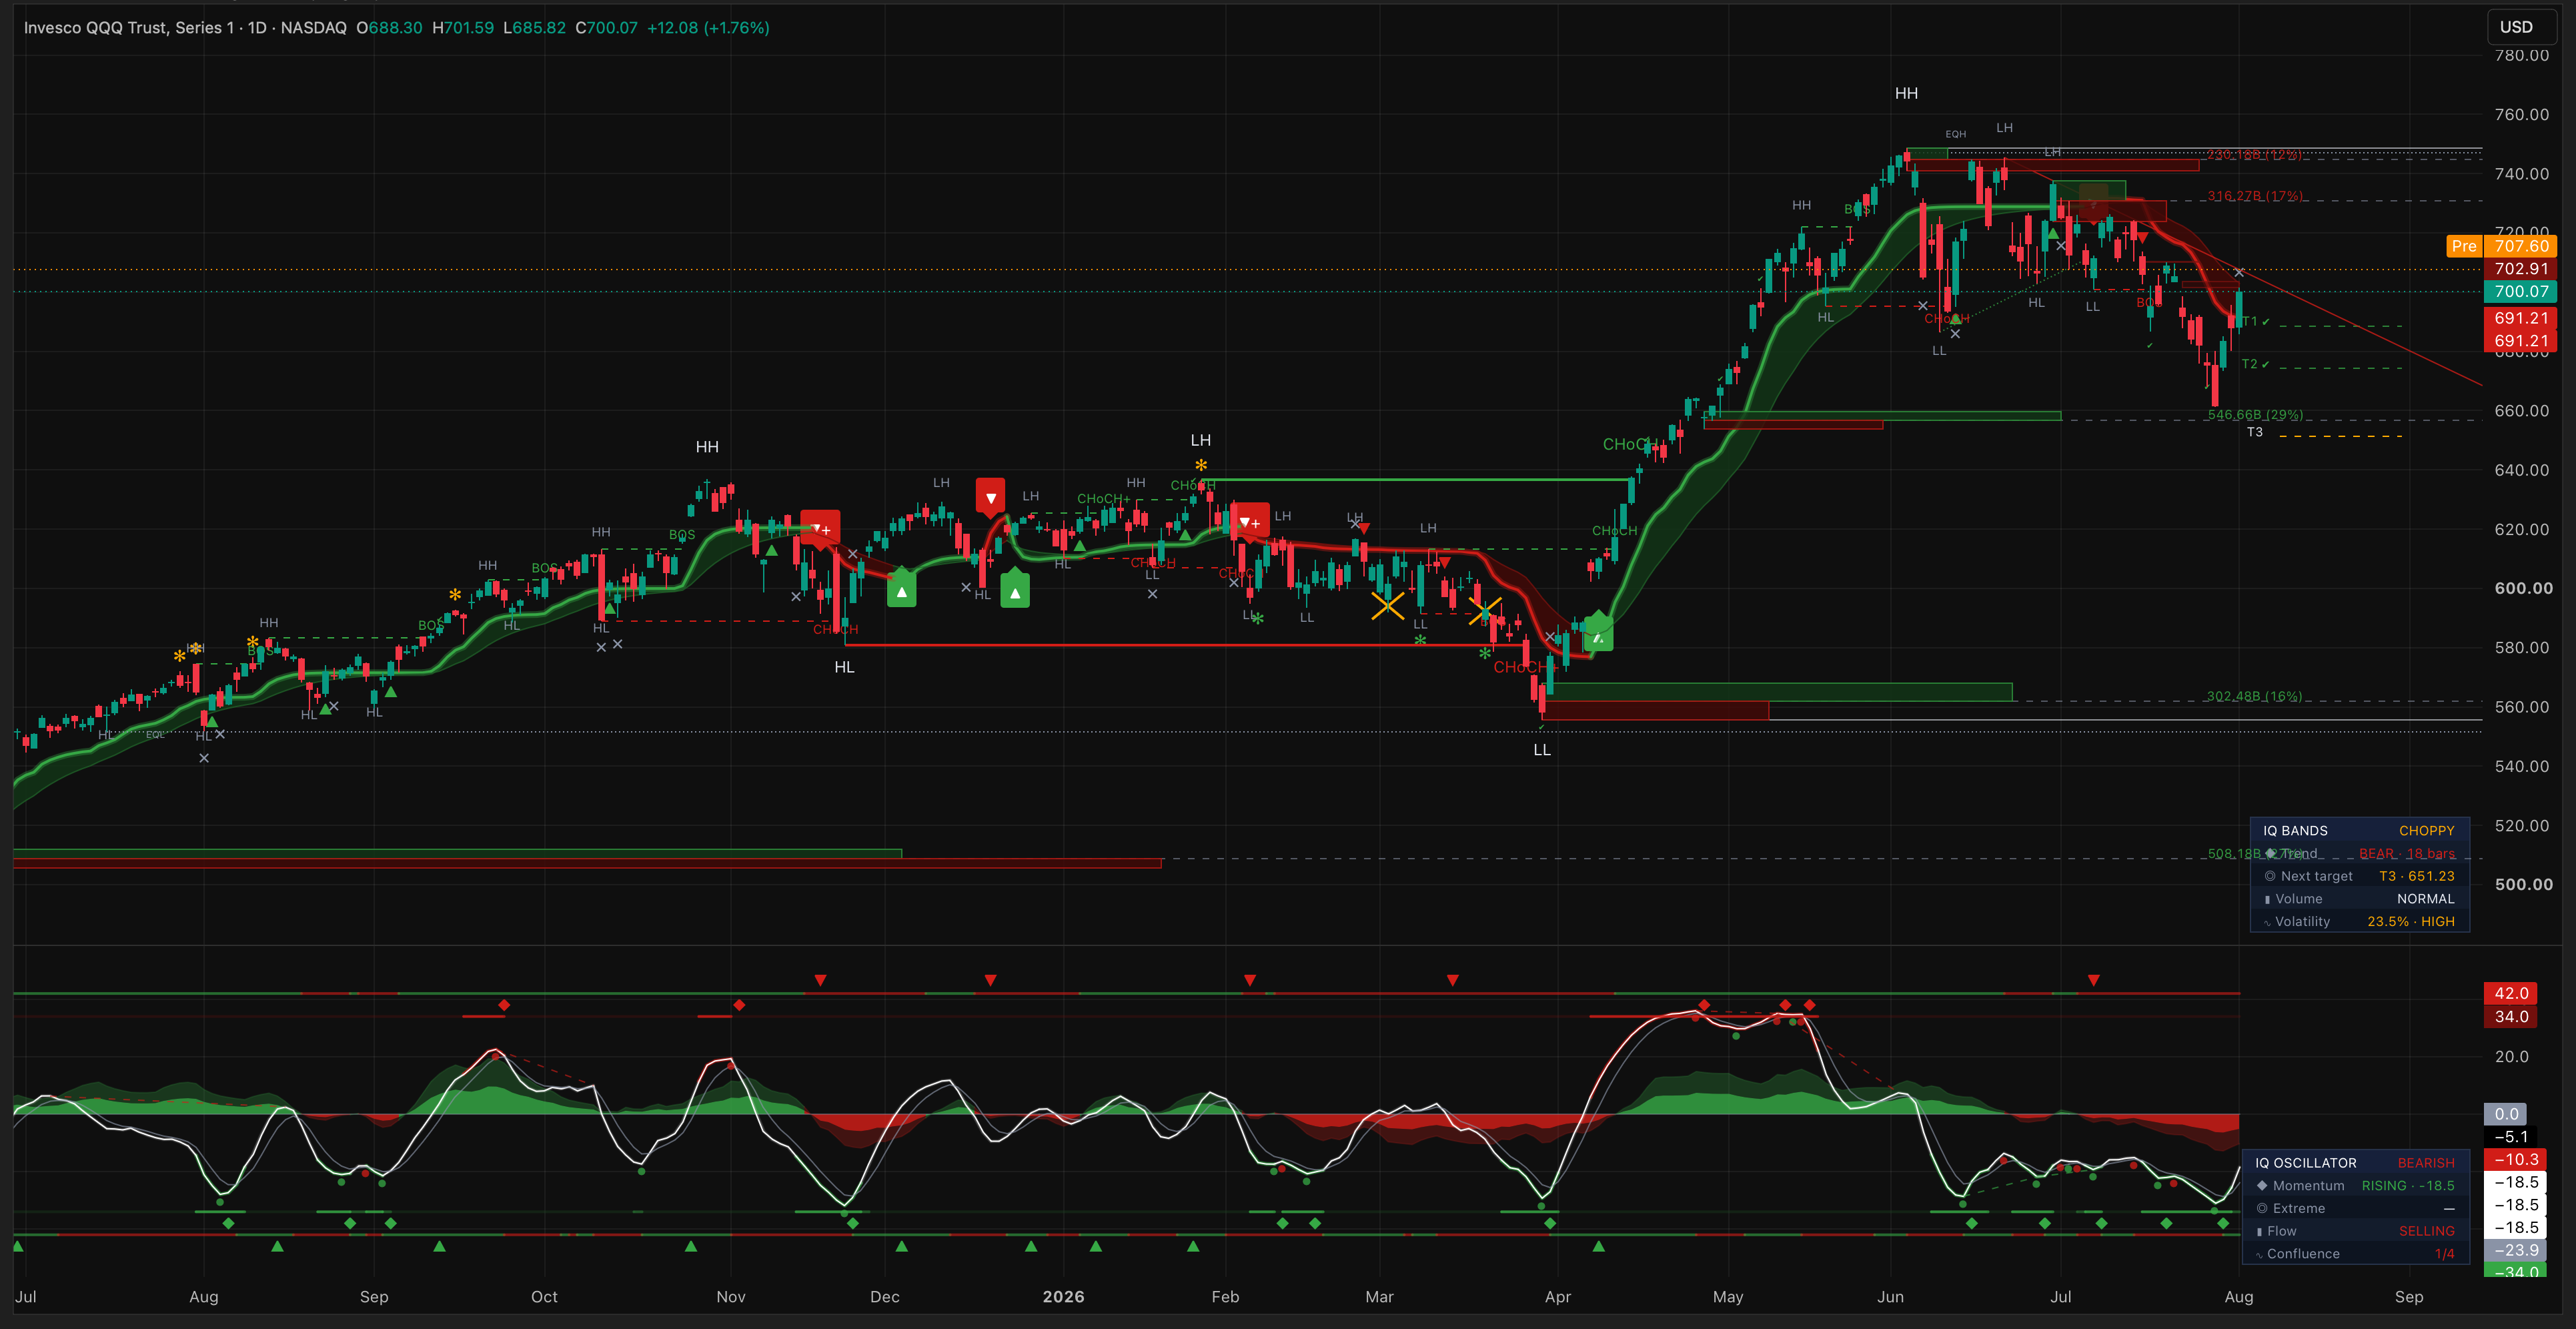
The confirmation stack
One timeframe agreeing is an opinion. The platform's signal products only speak when clocks agree: Triple Signals require the IQ Bands regime to align on 30 minutes, 2 hours and daily before a ticker makes the list — and the Short Term feed applies the same gate to the 1, 5 and 15 minute clocks for the most retail-traded names. You don't scan for alignment; alignment comes to you.
The platform
Around the indicators sits the members' platform: the Dashboard reads every ticker through the engines and writes a fresh analyst note per scan; two Screeners search the market by indicator state; Signals lists the triples; the Live Tape streams every engine event on the minute clocks as it happens; and the Analyst answers questions grounded in the same data. Each piece is documented in this guide's Platform section.
Start here
- Get the scripts on your chart.Follow the TradingView setup page — link your username once and the invite-only scripts appear in your Indicators dialog.
- Learn the Bands first.Read the IQ Bands guide and watch one ticker for a week. The regime discipline is the foundation everything else builds on.
- Add the Oscillator, then Structure.Momentum for timing, structure for location. Each guide ends with the playbook for combining them.
- Let the platform watch the clocks.Turn on Signals and the Live Tape, set your alerts, and stop staring at charts waiting for alignment.
Questions the guide doesn't answer end up in the FAQs — and anything beyond that, ask the Analyst from your dashboard.