BACKTEST STUDY · NQ AND ES FUTURES

We backtested the ICT killzones on NQ and ES. All 16 versions lost

One entry, a sweep of the last 20 candles' high or low, in each killzone for two years, costs charged. New York AM on MNQ, the highest profit factor of the 16, won 31.3% of 515 trades and lost $3,334 a micro contract. Copy the script, or run your own version free.

See all 515 trades free
  • The full Pine script, free to copy
  • All 16 versions, with every trade
  • Run opens it on MNQ with the backtest done: free account, no card
Killzone sweep · New York AM 07:00–10:00, 2RMNQ1! · 5-minute · 23 October 2024 → 22 October 2026
Net, a contract
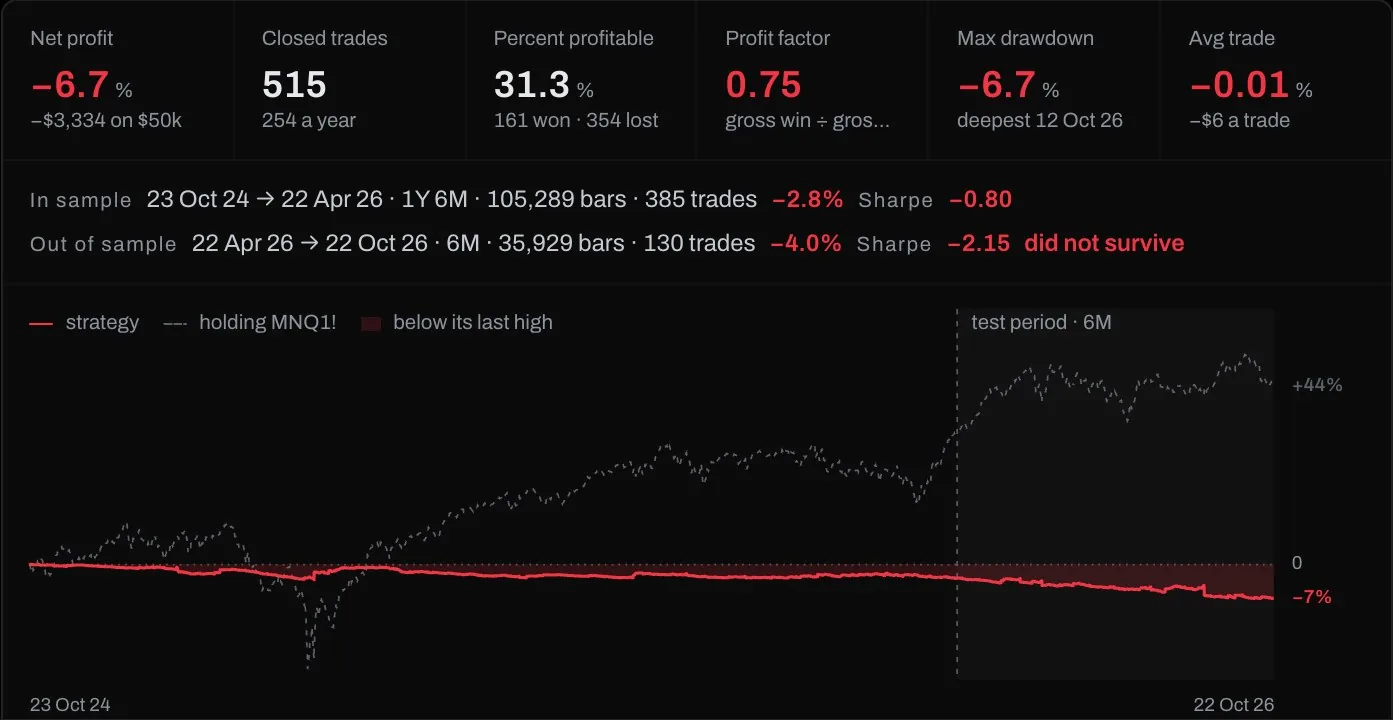
−$3,334
Trades
515
Won
31.3%
Profit factor
0.75
First 16 months−$1,090
Last 8 months−$2,244
Oct 2024Feb 2026Oct 2026

The $50,000 account after each of its 515 trades: one micro contract a trade, $2.50 a contract each side and a tick of slippage.

  • Checked 6 November 2026
  • CME data, 23 October 2024 → 22 October 2026 · 2 years · 517 sessions
  • $2.50 a contract each side + 1 tick of slippage
  • One micro contract a trade, flat by 15:55 New York
  • last third: 24 February 2026 → 22 October 2026 · 8 months
  • Updated 8 November 2026

Asia, London, New York AM, New York PM: every square lost

Each killzone's four versions over the two years: MNQ and MES, a 1R or a 2R target.

Asia 20:00–00:00 New York0 of 4 made money
London 02:00–05:00 New York0 of 4 made money
New York AM 07:00–10:00 New York0 of 4 made money
New York PM 13:30–16:00 New York0 of 4 made money

Each square is one version over the two years, after costs: green made money, red lost it.

16 versions · MNQ and MES · 5-minute candles · 517 sessions
Made money over two years
0 of 16
23 October 2024 → 22 October 2026
Made money in the last 8 months
0 of 16
24 February 2026 → 22 October 2026 · 8 months
Win rate at 2R
30.9–33.6%
on MNQ; a 2R target needs a third to win before costs
Smallest loss
−$3,056
MES, New York AM, 1R, the least any of the 16 lost

The script

Every run used it; change the inputs at the top to run any other row. Copy it into TradingView, or press Run and it opens in the terminal with its backtest done.

ICT killzone sweep reversal, New York AM 07:00–10:00, 2R

Inside the killzone, a candle that takes out the last 20 candles' low and closes back above it goes long at the next open, and its mirror goes short. The stop sits a tick beyond the sweep's wick and the target twice the risk away. One trade a killzone, flat at 15:55 New York.

Trades
515
Won
31.3%
Profit factor
0.75
Net
−6.7%
Worst drawdown
−6.7%
Worst trade
−$687

MNQ1! · 5-minute · 23 October 2024 → 22 October 2026 · 2 years · 517 sessions · $2.50 a contract each side, one tick of slippage, one micro contract a trade

Pine Script v6 · 43 linesRun this script
//@version=6
// Suggested timeframe: 5-minute
strategy("ICT killzone sweep reversal (New York AM 07:00-10:00)", overlay=true, initial_capital=50000, default_qty_type=strategy.fixed, default_qty_value=1, commission_type=strategy.commission.cash_per_contract, commission_value=2.5, slippage=1, margin_long=0, margin_short=0)

// Inside the killzone, a candle that takes out the last 20 candles' low and closes back above it
// goes long at the next open; one that takes out their high and closes back below goes short. The
// stop sits a tick beyond that candle's wick and the target a fixed multiple of the risk away. One
// trade a killzone; a trade still open is closed at 15:55 New York.
kz = input.session("0700-1000", "Killzone (New York)")
look = input.int(20, "Liquidity: the last N candles' high or low", minval=2)
rr = input.float(2.0, "Target, times the risk", minval=0.5, step=0.5)

inKz = not na(time(timeframe.period, kz, "America/New_York"))
nyMins = hour(time, "America/New_York") * 60 + minute(time, "America/New_York")

var bool done = false
if inKz and not inKz[1]
    done := false

lo = ta.lowest(low, look)[1]
hi = ta.highest(high, look)[1]
sweepLow = low < lo and close > lo
sweepHigh = high > hi and close < hi

if inKz and not done and strategy.position_size == 0
    if sweepLow
        stp = low - syminfo.mintick
        strategy.entry("Long", strategy.long)
        strategy.exit("Long exit", "Long", stop=stp, limit=close + rr * (close - stp))
        done := true
    else if sweepHigh
        stp = high + syminfo.mintick
        strategy.entry("Short", strategy.short)
        strategy.exit("Short exit", "Short", stop=stp, limit=close - rr * (stp - close))
        done := true

if strategy.position_size != 0 and nyMins >= 955 and nyMins < 965
    strategy.close_all(comment="Flat by the close")

plotshape(inKz and sweepLow and not done[1] and done, "Long sweep", shape.triangleup, location.belowbar, color.new(#16A56A, 0), size=size.tiny)
plotshape(inKz and sweepHigh and not done[1] and done, "Short sweep", shape.triangledown, location.abovebar, color.new(#E5484D, 0), size=size.tiny)
bgcolor(inKz ? color.new(#A3A39E, 92) : na, title="Killzone")
What Run opens

The Alpha Charts terminal with this page's script already on MNQ1! 5-minute. These are its own screens from that run.

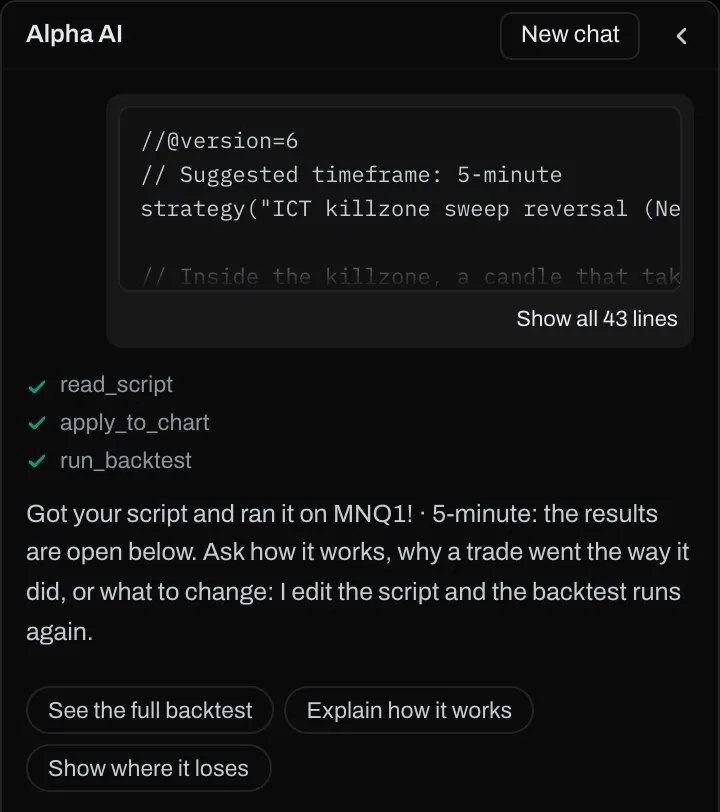
The terminal's chat with the killzone script read, put on the chart and backtested, and its reply
It lands on MNQ 5-minute and runs. The Copilot reads the script, puts it on the chart and runs the backtest. Ask it why a trade went the way it did, or tell it what to change: it edits the script and runs it again.
The terminal's results for the killzone script, with the months it held back
The results, with the months it never saw. The terminal holds back the last 6 months by default and says whether the result survived them.

Run your version free

Change the killzone, the lookback or the target, or paste your own killzone setup. It runs on the same CME data with the same costs, and every trade is on the chart.

Free account

No card, no time limit.

$0
  • Unlimited backtests, costs charged, with the out-of-sample check
  • The Pine script audit and the full trade list
  • The Pine Copilot writes and edits your script
  • 50 AI credits a day

Paid plans add more AI, the optimiser and the rest of the desk, each with 30 days money back. See the plans

The short answer

Not with this entry. A sweep of the last 20 candles' high or low, taken inside each ICT killzone, lost in all 16 versions on MNQ and MES, with a 1R or a 2R target, from 23 October 2024 to 22 October 2026 after costs.

On MNQ with a 2R target New York AM lost least, $3,334, and Asia most, $4,908; with 1R Asia lost least, $3,087. On ES every killzone lost between $3,056 and $5,219 a micro contract. With a 2R target the trades won 28% to 34% of the time: about the third a 2R target needs to break even before costs, and short of what it needs after them.

Two years of one setup on two markets, with the rules fixed before the runs and no setting tuned on the last eight months. Price results after modelled costs, not a forecast.

The rules

The same script in every run; only the killzone, the target and the market change.

  1. The killzones, New York time: Asia 20:00 to 00:00, London 02:00 to 05:00, New York AM 07:00 to 10:00 and New York PM 13:30 to 16:00.
  2. The entry: a candle inside the killzone that takes out the last 20 candles' low and closes back above it goes long at the next open; one that takes out their high and closes back below goes short.
  3. The stop: a tick beyond the sweep candle's wick. The target: 1 or 2 times the risk.
  4. One trade a killzone, one micro contract a trade, and flat at 15:55 New York.

All 16 versions

Dollars a contract after costs, with the last 8 months shown first. They are 24 February 2026 → 22 October 2026 · 8 months.

VersionLast 8 monthsFirst 16 monthsTwo yearsTradesWonProfit factor
MNQ · Asia 20:00–00:00 · 1R−$1,034−$2,052−$3,08751146.8%0.66
MNQ · Asia 20:00–00:00 · 2R−$2,528−$2,380−$4,90851131.3%0.62
MES · Asia 20:00–00:00 · 1R−$1,601−$2,615−$4,21650534.5%0.31
MES · Asia 20:00–00:00 · 2R−$1,866−$3,352−$5,21950527.9%0.36
MNQ · London 02:00–05:00 · 1R−$1,514−$2,034−$3,54951144.8%0.54
MNQ · London 02:00–05:00 · 2R−$1,904−$2,561−$4,46651130.9%0.57
MES · London 02:00–05:00 · 1R−$1,386−$2,215−$3,60150236.7%0.34
MES · London 02:00–05:00 · 2R−$1,711−$2,512−$4,22450230.3%0.42
MNQ · New York AM 07:00–10:00 · 1R−$1,258−$1,942−$3,19951543.7%0.68
MNQ · New York AM 07:00–10:00 · 2R−$2,244−$1,090−$3,33451531.3%0.75
MES · New York AM 07:00–10:00 · 1R−$890−$2,166−$3,05651242.8%0.53
MES · New York AM 07:00–10:00 · 2R−$702−$3,009−$3,71151231.8%0.59
MNQ · New York PM 13:30–16:00 · 1R−$1,118−$2,167−$3,28447950.9%0.69
MNQ · New York PM 13:30–16:00 · 2R−$1,368−$2,714−$4,08247933.6%0.71
MES · New York PM 13:30–16:00 · 1R−$839−$3,384−$4,22247944.3%0.44
MES · New York PM 13:30–16:00 · 2R−$1,165−$4,008−$5,17247931.1%0.48

The four killzones at 2R

Dollars a micro contract over the two years, after costs.

KillzoneMNQMES
Asia−$4,908−$5,219
London−$4,466−$4,224
New York AM−$3,334−$3,711
New York PM−$4,082−$5,172

Year by year

Killzone sweep · New York AM 07:00–10:00, 2R on MNQ1! 5-minute, in dollars a contract from its trade list.

YearTradesResult
2024 (from 23 Oct)49−$269
2025258−$1,038
2026 (to 22 Oct)208−$2,027

Test your own version, free

Run this script and change it in the terminal, or paste your own setup into the free NQ futures backtester. The same CME data and per-contract costs, the same check on the last third and every trade on the chart. No card.

More ICT setups, tested the same way

Each on the same two years of CME data, with every version and the months it never saw.

Questions

Do ICT killzones work?

Not with this entry. A sweep reversal inside each killzone lost in all 16 versions, on MNQ and MES, with a 1R or a 2R target, from 23 October 2024 to 22 October 2026 after costs. The smallest loss was $3,056 a micro contract (MES, New York AM, 1R); New York AM on MNQ with 2R, the highest profit factor, lost $3,334 over 515 trades.

What are the ICT killzone times for futures?

As ICT teaches them, in New York time: Asia 20:00 to 00:00, London 02:00 to 05:00, New York AM 07:00 to 10:00 and New York PM 13:30 to 16:00. CME's NQ and ES trade through all four, and these are the hours this test used.

Which killzone is best for NQ?

At 2R, New York AM lost least on MNQ, $3,334; at 1R, Asia did, $3,087. New York AM lost $3,199 at 1R, London lost $3,549 and $4,466, New York PM $3,284 and $4,082, and Asia $3,087 and $4,908.

Do ICT killzones work on ES?

Not in this test. On MES all 8 versions lost, between $3,056 and $5,219 a micro contract over two years, with profit factors from 0.31 to 0.59.

What win rate do killzone trades get?

31% to 34% with a 2R target and 44% to 51% with a 1R target on MNQ. A 2R target needs a third of its trades to win before costs, and a 1R target half; both fell short once costs were charged.

Can I test my own killzone strategy?

Yes. The script is on this page; Run this script opens the Alpha Charts terminal on MNQ 5-minute with the script on the chart and its backtest done. Change the killzone, the lookback or the target at the top, or paste your own strategy, and see every trade on the chart. A free account runs as many tests as you like, no card.

Every number here is the output of the Alpha Charts backtest engine on 6 November 2026, on CME futures data. Past results are not a forecast and nothing here is investment advice. ICT and its terms are Michael J. Huddleston's; TradingView and Pine Script belong to TradingView, Inc. Alpha Charts is not affiliated with either.

The killzone scriptFree account, no cardRun it free