BACKTEST STUDY · NQ AND ES FUTURES

ICT's power of three made money on NQ in all 8 versions. On ES, 2 of 8

16 versions on two years of real NQ and ES data, costs charged. On MNQ every version made money, +$1,084 to +$9,552 a micro contract, and the 09:30 entries held up in the 8 months the test held back. Copy the script, or run your own version free.

See all 289 trades free
  • The full Pine script, free to copy
  • All 16 versions, with every trade
  • Run opens it on MNQ with the backtest done: free account, no card
Power of three · 09:30 entry, Asia range targetMNQ1! · 5-minute · 23 October 2024 → 22 October 2026
Net, a contract
+$1,084
Trades
289
Won
44.3%
Profit factor
1.05
First 16 months−$84
Last 8 months+$1,168
Oct 2024Feb 2026Oct 2026

The $50,000 account after each of its 289 trades: one micro contract a trade, $2.50 a contract each side and a tick of slippage.

  • Checked 6 November 2026
  • CME data, 23 October 2024 → 22 October 2026 · 2 years · 517 sessions
  • $2.50 a contract each side + 1 tick of slippage
  • One micro contract a trade, flat by 15:55 New York
  • last third: 24 February 2026 → 22 October 2026 · 8 months
  • Updated 8 November 2026

On NQ, 8 of 8 versions made money. On ES, 2 of 8

Each version over the two years: an entry at 09:30 or 10:00 New York, the far side of the Asia range or a 1R, 2R or 3R target.

MNQ · enter at 09:30 New York4 of 4 made money
MNQ · enter at 10:00 New York4 of 4 made money
MES · enter at 09:30 New York0 of 4 made money
MES · enter at 10:00 New York2 of 4 made money

Each square is one version over the two years, after costs: green made money, red lost it.

16 versions · MNQ and MES · 5-minute candles · 517 sessions
Made money over two years
10 of 16
23 October 2024 → 22 October 2026
Made money in the last 8 months
5 of 16
24 February 2026 → 22 October 2026 · 8 months
Best version
+$9,552
MNQ, 09:30, 3R, profit factor 1.26
MNQ 09:30 in the last 8 months
4 of 4
made money in the 8 months, +$1,168 to +$2,834

The script

Every run used it; change the inputs at the top to run any other row. Copy it into TradingView, or press Run and it opens in the terminal with its backtest done.

ICT power of three, 09:30 New York, target the far side of the Asia range

The Asia range from 20:00 to 00:00 New York; if London (02:00 to 05:00) takes out its low, the trade goes long at 09:30, and if it takes out its high, short. The stop sits a tick beyond the night's extreme on the swept side and the target at the far side of the Asia range. One trade a day, flat at 15:55 New York.

Trades
289
Won
44.3%
Profit factor
1.05
Net
+2.2%
Worst drawdown
−6.3%
Worst trade
−$765

MNQ1! · 5-minute · 23 October 2024 → 22 October 2026 · 2 years · 517 sessions · $2.50 a contract each side, one tick of slippage, one micro contract a trade

Pine Script v6 · 72 linesRun this script
//@version=6
// Suggested timeframe: 5-minute
strategy("ICT power of three (Asia range, London sweep, New York 9:30)", overlay=true, initial_capital=50000, default_qty_type=strategy.fixed, default_qty_value=1, commission_type=strategy.commission.cash_per_contract, commission_value=2.5, slippage=1, margin_long=0, margin_short=0)

// Accumulation: the Asia range, 20:00 to 00:00 New York. Manipulation: London, 02:00 to 05:00,
// takes out one side of it. Distribution: at the New York entry time the trade goes the other way,
// long after a sweep of the Asia low and short after a sweep of its high (both sides taken: no
// trade). The stop sits a tick beyond the night's extreme on the swept side; the target is the far
// side of the Asia range, or a fixed multiple of the risk. Flat at 15:55 New York.
entryAt = input.int(930, "Entry time (HHMM, New York)")
tgtMode = input.string("Asia range", "Target", options=["Asia range", "1R", "2R", "3R"])

nyMins = hour(time, "America/New_York") * 60 + minute(time, "America/New_York")
entryMins = math.floor(entryAt / 100) * 60 + entryAt % 100
inAsia = nyMins >= 1200
inLondon = nyMins >= 120 and nyMins < 300

var float asiaHi = na
var float asiaLo = na
var bool tookLow = false
var bool tookHigh = false
var float nightLo = na
var float nightHi = na
var bool armed = false

if inAsia and not inAsia[1]
    asiaHi := high
    asiaLo := low
    tookLow := false
    tookHigh := false
    nightLo := low
    nightHi := high
    armed := true
else if inAsia
    asiaHi := math.max(asiaHi, high)
    asiaLo := math.min(asiaLo, low)
    nightLo := math.min(nightLo, low)
    nightHi := math.max(nightHi, high)
if not inAsia and nyMins < entryMins and not na(asiaHi)
    nightLo := math.min(nightLo, low)
    nightHi := math.max(nightHi, high)
if inLondon and not na(asiaLo)
    if low < asiaLo
        tookLow := true
    if high > asiaHi
        tookHigh := true

atEntry = nyMins >= entryMins and nyMins[1] < entryMins
if atEntry and armed and strategy.position_size == 0
    armed := false
    if tookLow and not tookHigh
        stp = nightLo - syminfo.mintick
        risk = close - stp
        tgt = tgtMode == "Asia range" ? asiaHi : close + str.tonumber(str.replace(tgtMode, "R", "")) * risk
        if risk > 0 and tgt > close
            strategy.entry("Long", strategy.long)
            strategy.exit("Long exit", "Long", stop=stp, limit=tgt)
    else if tookHigh and not tookLow
        stp = nightHi + syminfo.mintick
        risk = stp - close
        tgt = tgtMode == "Asia range" ? asiaLo : close - str.tonumber(str.replace(tgtMode, "R", "")) * risk
        if risk > 0 and tgt < close
            strategy.entry("Short", strategy.short)
            strategy.exit("Short exit", "Short", stop=stp, limit=tgt)

if strategy.position_size != 0 and nyMins >= 955 and nyMins < 965
    strategy.close_all(comment="Flat by the close")

plot(asiaHi, "Asia high", color.new(#A3A39E, 20), style=plot.style_linebr)
plot(asiaLo, "Asia low", color.new(#A3A39E, 20), style=plot.style_linebr)
bgcolor(inLondon ? color.new(#E3A008, 92) : na, title="London")
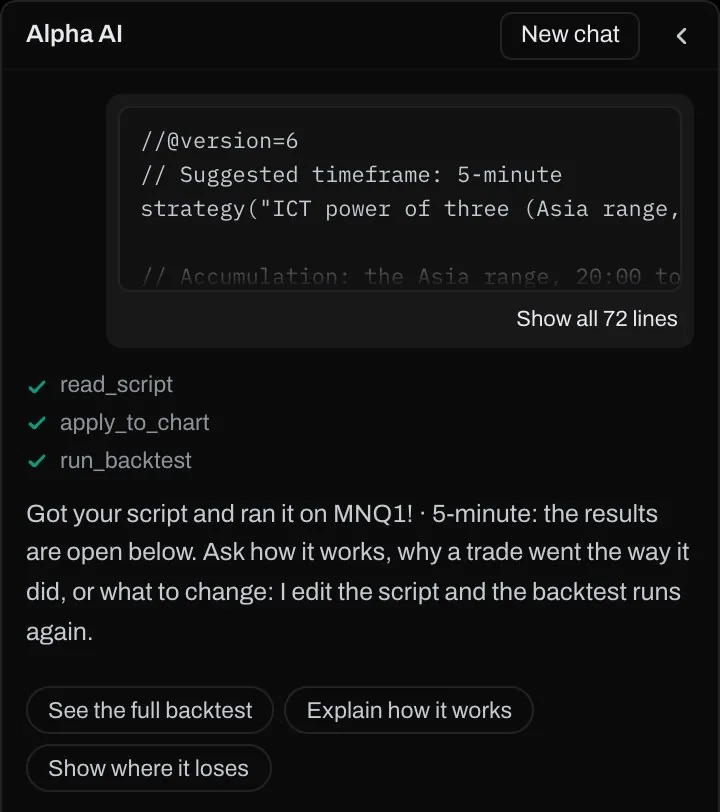
What Run opens

The Alpha Charts terminal with this page's script already on MNQ1! 5-minute. These are its own screens from that run.

The terminal's chat with the power of three script read, put on the chart and backtested, and its reply
It lands on MNQ 5-minute and runs. The Copilot reads the script, puts it on the chart and runs the backtest. Ask it why a trade went the way it did, or tell it what to change: it edits the script and runs it again.
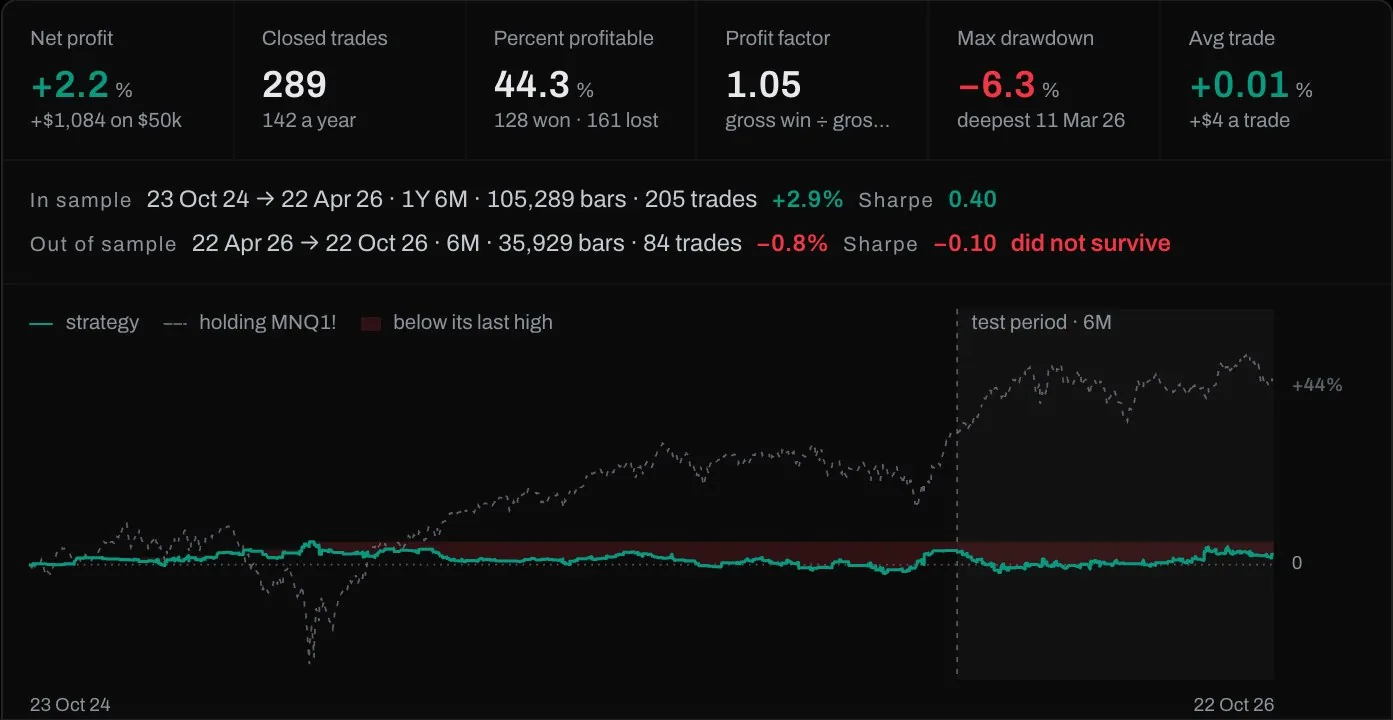
The terminal's results for the power of three script, with the months it held back
The results, with the months it never saw. The terminal holds back the last 6 months by default and says whether the result survived them. This version lost $390 there, so it did not; the 1R, 2R and 3R versions made money there.

Run your version free

Change the entry time or the target, or paste your own power of three. It runs on the same CME data with the same costs, and every trade is on the chart.

Free account

No card, no time limit.

$0
  • Unlimited backtests, costs charged, with the out-of-sample check
  • The Pine script audit and the full trade list
  • The Pine Copilot writes and edits your script
  • 50 AI credits a day

Paid plans add more AI, the optimiser and the rest of the desk, each with 30 days money back. See the plans

The short answer

On NQ, yes over these two years. All 8 MNQ versions made money after costs, from +$1,084 to +$9,552 a micro contract, and the 09:30 entries made money in the 8 months the test held back too, +$1,168 to +$2,834.

Not everywhere. At 10:00 the fixed targets on MNQ made more in the first 16 months and lost $3,820 to $4,218 in the 8 months after, and on ES 2 of 8 versions made money over two years and none in those 8 months. In the terminal's own check, the last 6 months alone, the Asia-range version on this page lost $390 while the 1R, 2R and 3R versions made $268 to $1,652. One market, one entry time and two years is a lead to test further, not an edge.

Two years of one setup on two markets, with the rules fixed before the runs and no setting tuned on the last eight months. Price results after modelled costs, not a forecast.

The rules

The same script in every run; only the entry time, the target and the market change.

  1. Accumulation: the Asia range, the high and low from 20:00 to 00:00 New York.
  2. Manipulation: London, 02:00 to 05:00 New York, takes out the Asia low or the Asia high. A night that takes out both is skipped.
  3. Distribution: at 09:30 or 10:00 New York the trade goes the other way: long after a sweep of the low, short after a sweep of the high.
  4. The stop: a tick beyond the night's extreme on the swept side. The target: the far side of the Asia range, or 1, 2 or 3 times the risk.
  5. One trade a day, one micro contract, flat at 15:55 New York.

All 16 versions

Dollars a contract after costs, with the last 8 months shown first. They are 24 February 2026 → 22 October 2026 · 8 months.

VersionLast 8 monthsFirst 16 monthsTwo yearsTradesWonProfit factor
MNQ · 09:30 · Asia range target+$1,168−$84+$1,08428944.3%1.05
MNQ · 09:30 · 1R+$1,790+$1,462+$3,25235051.7%1.10
MNQ · 09:30 · 2R+$2,730+$4,414+$7,14435042.0%1.20
MNQ · 09:30 · 3R+$2,834+$6,717+$9,55235039.4%1.26
MNQ · 10:00 · Asia range target+$543+$4,388+$4,93229849.0%1.22
MNQ · 10:00 · 1R−$3,882+$8,906+$5,02437354.2%1.14
MNQ · 10:00 · 2R−$4,218+$8,215+$3,99637346.6%1.10
MNQ · 10:00 · 3R−$3,820+$7,398+$3,57737344.8%1.09
MES · 09:30 · Asia range target−$2,151−$1,330−$3,48130539.7%0.74
MES · 09:30 · 1R−$1,219−$298−$1,51636849.7%0.92
MES · 09:30 · 2R−$1,891+$662−$1,22936739.0%0.94
MES · 09:30 · 3R−$1,739+$1,416−$32236636.3%0.98
MES · 10:00 · Asia range target−$1,916+$36−$1,88030042.0%0.86
MES · 10:00 · 1R−$3,136+$3,230+$9437653.7%1.01
MES · 10:00 · 2R−$3,025+$3,875+$85037446.0%1.04
MES · 10:00 · 3R−$3,359+$3,118−$24137342.9%0.99

09:30 or 10:00: the months it never saw

MNQ, dollars a micro contract in the last 8 months.

Target09:3010:00
Far side of the Asia range+$1,168+$543
1R+$1,790−$3,882
2R+$2,730−$4,218
3R+$2,834−$3,820

Year by year

Power of three · 09:30 entry, Asia range target on MNQ1! 5-minute, in dollars a contract from its trade list.

YearTradesResult
2024 (from 23 Oct)15+$324
2025147+$77
2026 (to 22 Oct)127+$682

Test your own version, free

Run this script and change it in the terminal, or paste your own setup into the free NQ futures backtester. The same CME data and per-contract costs, the same check on the last third and every trade on the chart. No card.

More ICT setups, tested the same way

Each on the same two years of CME data, with every version and the months it never saw.

Questions

Does the ICT power of three work?

On NQ in this test it made money: all 8 MNQ versions after costs, from +$1,084 to +$9,552 a micro contract over two years. On ES, 2 of 8 did. Every 09:30 entry on MNQ also made money in the 8 months the test held back.

What is the ICT power of three (AMD)?

Accumulation, manipulation, distribution: the Asia session builds a range (20:00 to 00:00 New York), London takes out one side of it (02:00 to 05:00), and New York moves the other way. This test trades that last leg: long after a London sweep of the Asia low, short after a sweep of the high, nothing when London took both sides.

Does the power of three work on ES?

Not in this test. 2 of 8 MES versions made money over two years, +$94 and +$850 a micro contract, and all 8 lost in the last 8 months.

Which target works best for the power of three?

On MNQ at 09:30 the wider target made more: the far side of the Asia range +$1,084, 1R +$3,252, 2R +$7,144 and 3R +$9,552, with the win rate falling from 51.7% to 39.4%.

Should the power of three enter at 09:30 or 10:00?

09:30 held up better. On MNQ every 09:30 version made money in the last 8 months. At 10:00 the Asia-range target made $543 in them, and the fixed targets, which made more before them, lost $3,820 to $4,218.

Can I run the power of three on my own settings?

Yes. The script is on this page; Run this script opens the Alpha Charts terminal on MNQ 5-minute with the script on the chart and its backtest done. Change the entry time or the target at the top, or paste your own strategy, and see every trade on the chart. A free account runs as many tests as you like, no card.

Every number here is the output of the Alpha Charts backtest engine on 6 November 2026, on CME futures data. Past results are not a forecast and nothing here is investment advice. ICT and its terms are Michael J. Huddleston's; TradingView and Pine Script belong to TradingView, Inc. Alpha Charts is not affiliated with either.

The power of three scriptFree account, no cardRun it free